Current intelligence
Know what needs attention
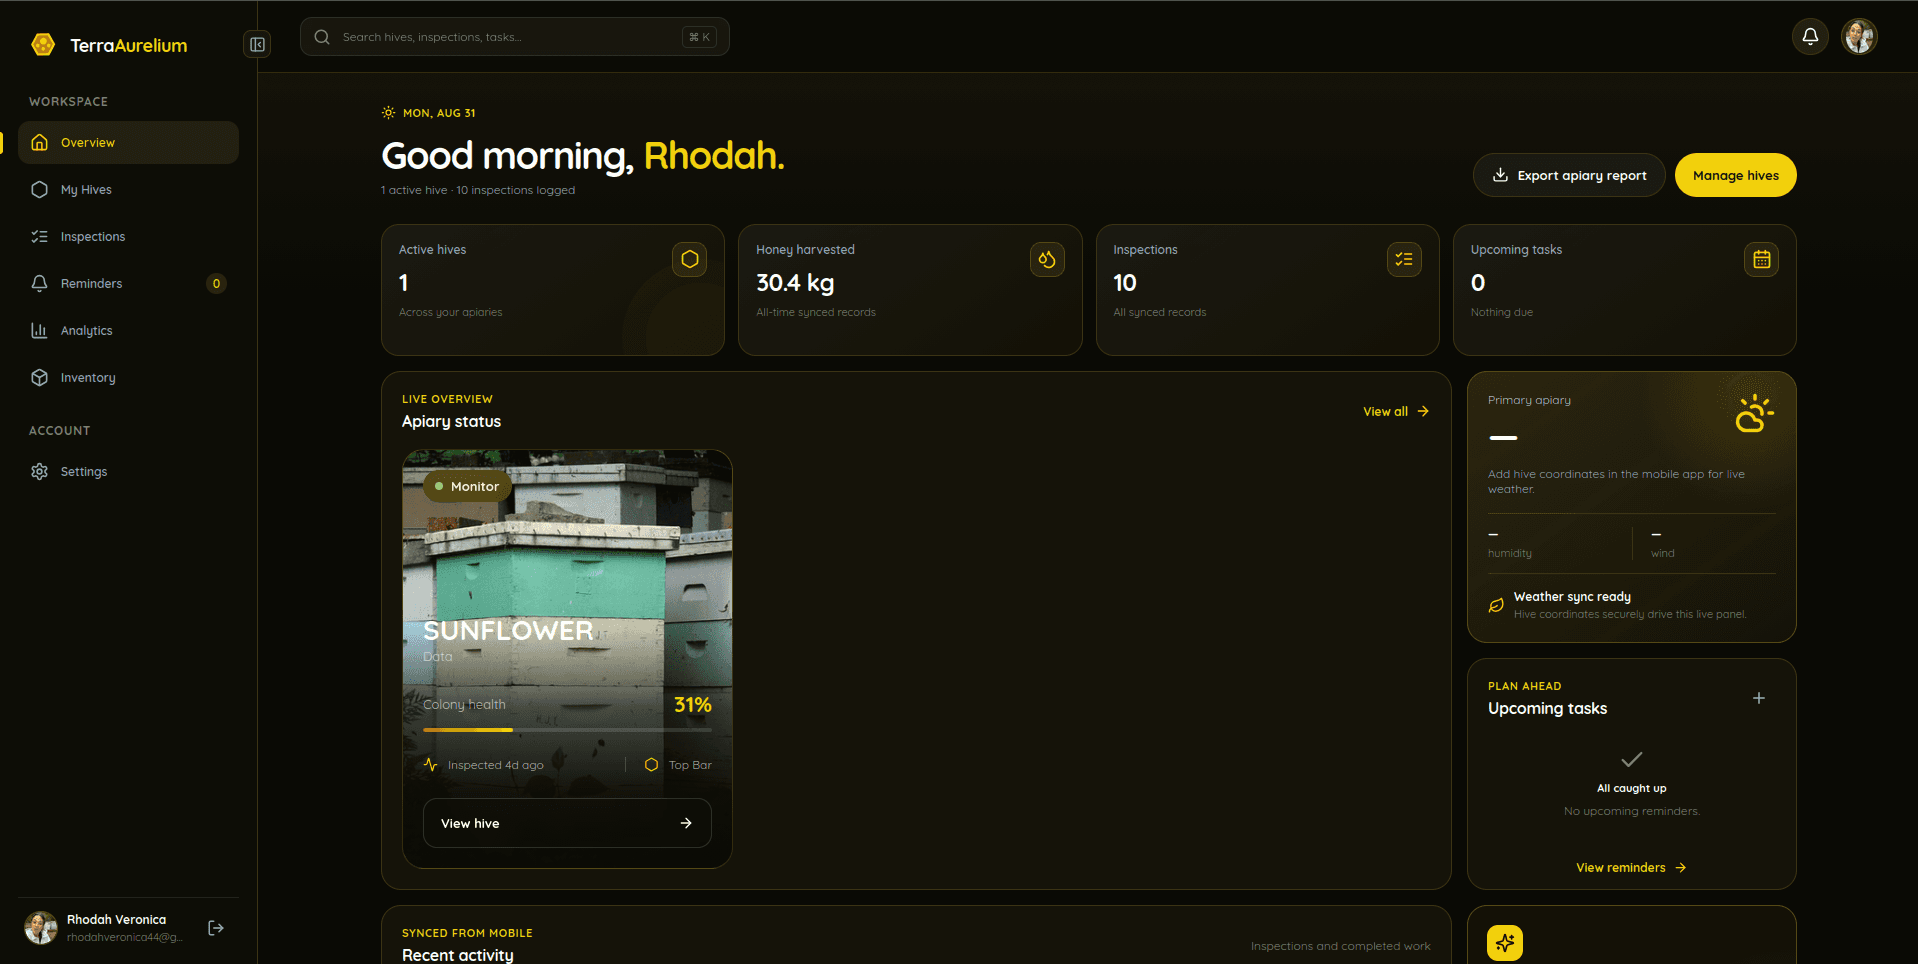
Surface health, pest, queen, brood, and treatment signals without searching every inspection.
Turn field records into a living picture of colony health, inspections, harvests, treatments, and the work that matters next.
1,000+
beekeepers in the community
Offline-first
field capture that keeps moving
One account
from mobile input to web insight
Live context
across hives, weather, and work
One operating picture
TerraAurelium keeps the detail of every field observation, then makes the patterns easy to see when you return to your desk.
Current intelligence
Surface health, pest, queen, brood, and treatment signals without searching every inspection.
Apiary comparison
Compare performance across hives and locations while keeping every insight tied to its record.
Yield intelligence
Connect harvest weight, frames, moisture, grades, and batches to colony and apiary history.
Varroa + treatments
Keep mite checks, treatment timing, due dates, and before-and-after evidence in one timeline.
Reporting
Turn structured field activity into clear operational summaries and export-ready reports.
Planning confidence
Bring weather windows, mapped apiaries, stock levels, and follow-ups into the same decision.
Built for the real workflow
The dashboard is not another place to enter data. It is where the work already captured in the field becomes useful at operational scale.
Get the mobile app01
Record inspections, queen evidence, brood, Varroa checks, treatments, harvests, notes, and follow-ups, even when connectivity is limited.
02
Every record stays associated with the right hive, apiary, date, and inspection, then syncs when a connection returns.
03
Compare history, review outcomes, spot patterns, and decide which hives and tasks deserve attention next.
Context compounds
Brood pattern, queen status, hive weight, weather, treatment history, and follow-up work stop living as isolated facts. The dashboard shows how they connect.
Hive 12 · North apiary
Colony snapshot
Field input
Brood pattern · compact
Historical context
Stable across 3 inspections
Related signal
Queen seen · 4 days ago
Next action
No immediate follow-up
The TerraAurelium difference
Re-enter data at a desk
Field records flow into the same connected account
Charts lose inspection context
Every insight stays tied to hive, apiary, and date
Data capture requires signal
Offline-first work syncs when connection returns
Generic business workflow
Beekeeping-specific records, language, and decisions
Explore the system
Turn current evidence into a focused follow-up queue.
Track checks, thresholds, treatments, and outcomes.
Keep queen evidence and acceptance checks visible.
Plan visits around mapped apiaries and work windows.
See treatment stock and supply levels before fieldwork.
Create clear reports from inspections and harvests.
Questions, answered
It is the desktop analytics companion to the TerraAurelium beekeeping app. It turns structured inspection, hive, apiary, task, health, and yield records into a wider operational view that is easier to compare and review.
No. The mobile app is designed for fast, offline-first data capture at the hive. The web dashboard complements it with more space for analysis, history, comparisons, and reporting.
Record work in the TerraAurelium app even when connectivity is limited. Once the app can sync, those structured records become available in the web dashboard using the same account.
Review inspection intelligence, colony and brood observations, queen status, Varroa monitoring, treatment follow-ups, apiary performance, honey yield, inventory, weather work windows, and recurring work.
Hobbyists can spot changes without searching through notes, while growing and commercial apiaries gain a consistent way to compare locations, hives, seasons, and follow-up work.
Use any Open dashboard link on this page. It opens in a new browser tab, so this guide stays available for reference.
Review your field records with more space, more context, and a clearer view of what comes next.
Open dashboard